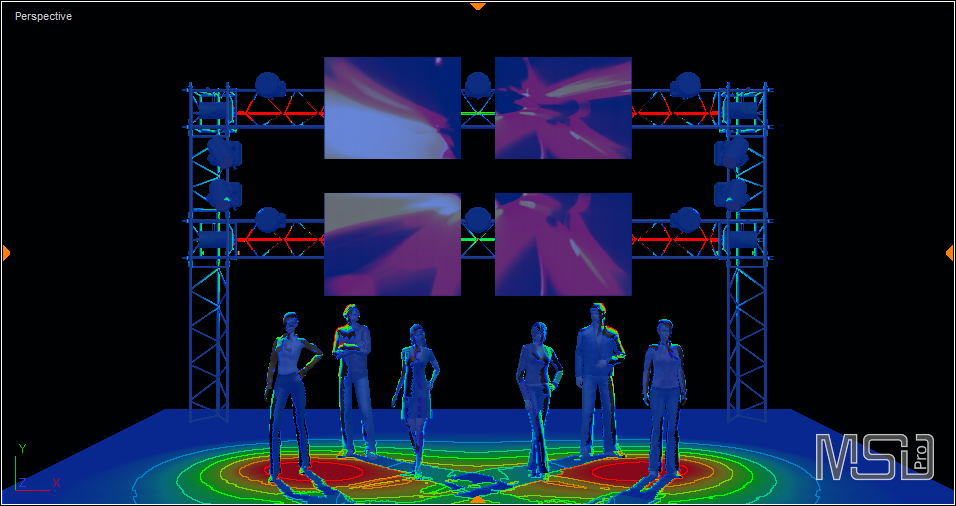
When you activate 'the 'LuxMap' display mode, the view gets an 'overlay' of false-colors, indicating the illumination (in lux) on the surfaces you see.
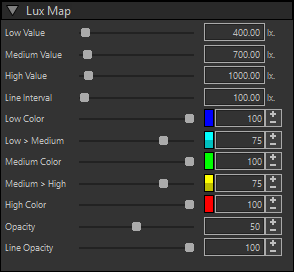
With the Settings in the Sidebar section for the Lux Map, you can specify how this overlay should look.
Low, Medium and High Value
The first 3 properties (Low, Medium and High values) determine the 'active' range that you are interested in. (They are specified in lux values.)
Values below the 'Low Value are ignored, and everything above the 'High Value' is displayed in the same color.
Line interval
Every pixel above the low value is painted with a color, but you can also define iso-lines of a particular value, and let them stand out more on the overlay by setting a different opacity for iso-lines.
With this property you can set at what intervals these iso-lines should be drawn.
Colors
The false colors used for the illumination values is specified by next five properties, from 'Low Color' to 'High Color', to match the range from 'Low Value' to 'High Value'.
Opacity
With the 2 opacity properties you can set the 'density' of the overlay and the isi-lines.
The resulting view will give you a good (real-time) idea on the light distribution and illumination of your scene.
