How to Create and View an Illuminance Map
Illumination Maps are mainly use in architectural.
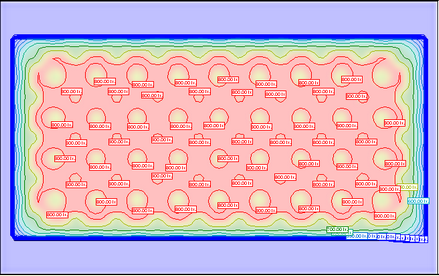
It represent the light distribution over a surface by the mean of isobar lines.
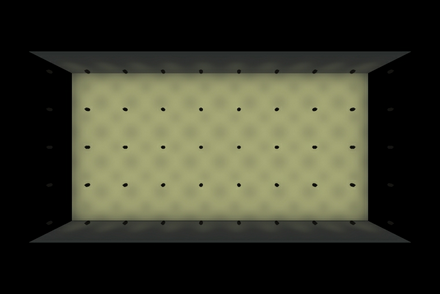
Here's an example of a regular rendering and the same view as illuminance Map
How to create this view?
All start in the Show Designer module.
Choose a 2D view and zoom to the portion of the scene you want to create an Illumination Map
From there, go to the Window menu and click on Generate Illuminance Map.
This window control will appear
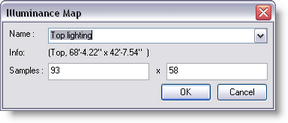
By default a name is given according to the current view, but you can change it
The sample is the number of reading done on the view, the more samples, the more accurate the reading will be.
Repeat the process to generate illuminance Map for other point of view.
Once finish, save the scene and close it. or save and press the Fast Switch to Paper Module![]()
Start the MSD Paper Module and open the scene you just saved.
-In the Edit menu, create a new Sheet

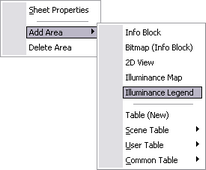
On that new sheet, add an Area for Illuminance Map, to do so, right-click and do as follow
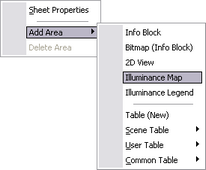
Once the Area on the sheet, resize it to size you want.
-Right-Click on it and select View Properties

Illuminance Properties
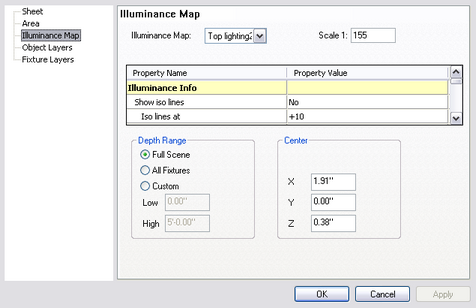
In the Illuminance Map field select the one of the map you generated earlier in the Show Designer module.
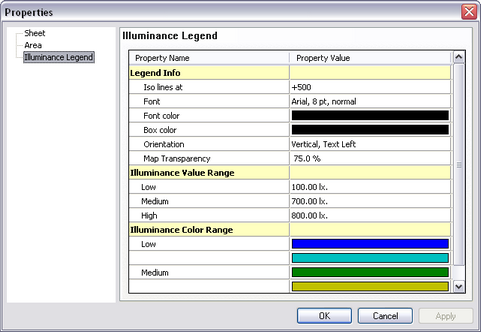
Other settings can be changed
-Show Iso Line: To display or not the iso line on the Map
-Iso lines at: The iso lines can be defined as a ';' separated list of ranges, which are defined like this 'min-max+delta'
So '5;-1000+10;1000-5000+500;5000-+1000' will have lines at 5 lux, from 0 lux to 1000 lux every 10 lux, from 1000 to
5000 every 500 lux and from 5000 onwards every 1000 lux ( 0,5,10,20, .... ,980,990,1000,1500,2000, ... , 4500,5000,6000,7000 ...)
Also you can set '+500' to see an iso line every 500 lux.
-Show Iso values: When enable, a value will be shown on every iso line
-Font: Set the font Size and Style
-Font color: Set the font color for the Iso values
-Show map: when set to yes, a graduated scale map will be shown in the background
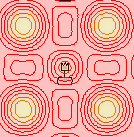
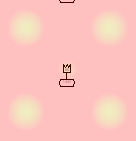
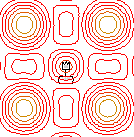
Map and Line Map only Line only
-Map Transparency: set the intensity of the graduated map
-Illuminance Value Range: Set the range in which you are interested to see values
-Illuminance Color Range:Set the color representation of each range.
Once the setting done, click Ok to accept.
You can now set the view you want to see, right-click on the map area and select Define View.
Adjust the view and click OK.
It is also possible to add a Illuminance Map Legend
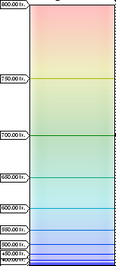
The legend properties can be change like the map properties
